
Where are we now?
After last year’s tranquil environment, markets experienced a sharp pullback in February and have returned to a more normal level of volatility. As a result, many investors are wondering, where are we now and what’s next? The chart below highlights how recent events compare to the prior 11 corrections.
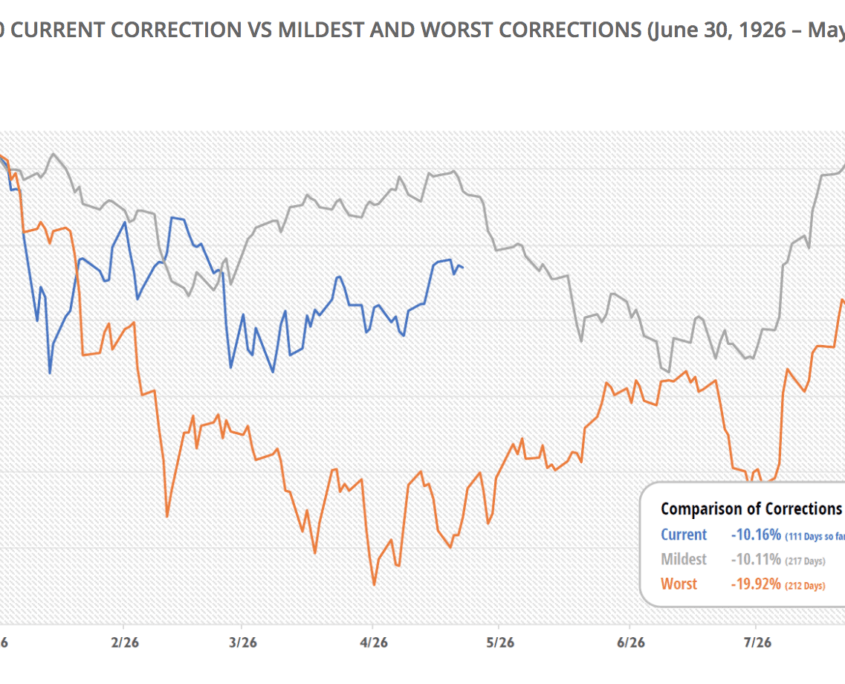
Current, mildest and worst corrections all plotted to begin on Jan 26, 2018 and scaled to start at the same index price level. Source: S&P Dow Jones Indices LLC.
Corrections are defined as a drawdown greater than 10% and less than 20% from an all-time high. This correction would currently rank as the second mildest on record should the market recover to new highs from here. On average, corrections have a 13.3% drawdown and last almost 8 months from peak-to-peak. The mildest correction charted above lasted from September 1967 to April 1968, while the worst correction began in July 1990 and ended in February 1991. Should the current event follow a similar timeline, we would expect the market to begin to set new highs towards the end of August this year.
Of course, there are no guarantees that the market won’t decline from here and break below the 20% drawdown mark, resulting in a Bear Market, but it is our opinion the underlying strength of the economy and corporate earnings make that outcome remote in the near-term. It is much more likely that the market will remain choppy and take some time to recover, which is a more normal pattern than the unusual calm of 2017.
From the Behavioral Viewpoint
What is going on?
We are easily fooled by randomness. Short-term market volatility is largely random. The pundits and others would have us believe they can explain market movements and we want to believe them! The stock market decline was due to “Political uncertainty, rising rates, fill in the blank”
Due to recency effect, we tend to value recent data with a greater weight than earlier data that may be just as important. In this case, last year’s calm environment and this year’s sharp volatility are recent and fresh in contrast to a longer-term perspective.
We anchor or focus on one data point, such as the market peak in January, and ignore other data. We were up at the beginning of the year but have come down since.
Drawdowns trigger uncertainty and risk aversion, and we are twice as sensitive to a loss as an offsetting gain and prefer known returns to unknown returns, even if on average the unknown returns are higher.
What can we do?
Take a vacation from watching market gauges and tune out the market and geo-political pundits.
Stay focused on long-term plans and goals. Have a well thought out financial plan with a disciplined investment process designed to build wealth over time.
Work with an experienced financial advisor as a trusted partner that can act as a reliable sounding board to help you stay on track.
Join Us
Financial professionals can gain access to additional published behavioral investing resources by registering on our website:
Leave a Reply